Benchmarking Agentgateway vs LiteLLM
A head-to-head proxy benchmark comparing agentgateway and LiteLLM on throughput, latency, CPU, and memory using Fortio and a mock LLM backend.
One of the coolest features in the agentgateway 1.3 release is Virtual Models. It made me realize I could use agentgateway locally to manage all of my LLM API keys while also getting visibility into my LLM usage and costs.
I’ve heard good things about LiteLLM for quite a while, so I decided to compare its performance with agentgateway. My goal is to find a lightweight gateway that can handle very high throughput with minimal latency. (I occasionally ask LLMs to generate videos, which results in a lot of API traffic.)
Instead of comparing features, I wanted to answer a simple question:
How much overhead does each proxy introduce under load?
Specifically, I measured:
- Throughput (QPS)
- Request latency
- CPU utilization
- Memory usage
Test setup
The benchmark uses a very simple architecture. A mock LLM server immediately returns a fixed response so the benchmark measures proxy overhead rather than model inference time.
Fortio generates as much traffic as possible against each gateway.
fortio (bt) ──► litellm :4000 ───────┐
                                     ├──► mock-server (hyper-server) :8081
fortio (bt) ──► agentgateway :4001 ──┘
I ran the benchmark using the default configuration:
./scripts/run-benchmark.shThe benchmark uses:
- 32 concurrent connections
- Maximum possible throughput (unlimited QPS)
- 1 KB request payloads
- 3-second benchmark duration
Results
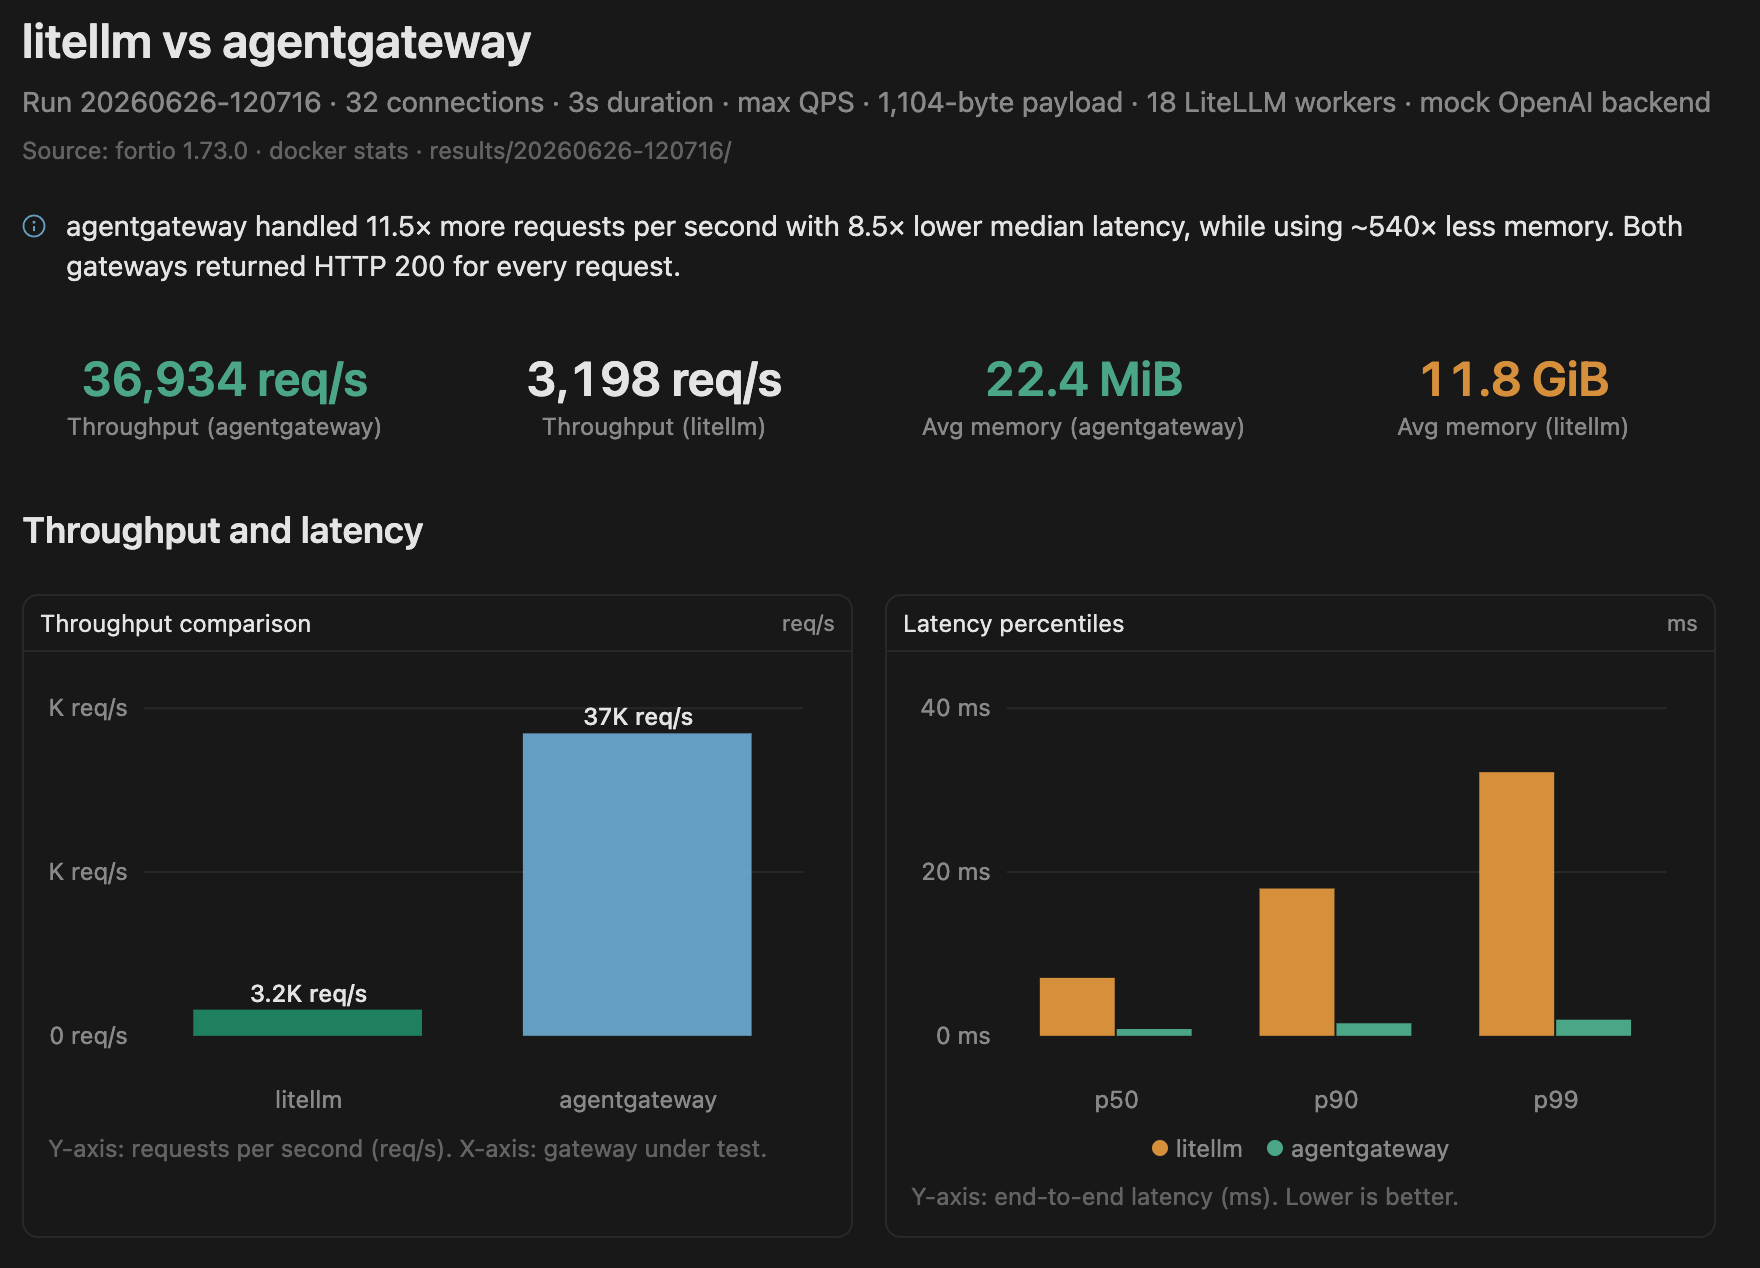
Throughput & Latency
| Gateway | Throughput | P50 | P90 | P99 |
|---|---|---|---|---|
| agentgateway | 36,933 QPS | 0.831 ms | 1.533 ms | 1.970 ms |
| LiteLLM | 3,198 QPS | 7.076 ms | 17.986 ms | 32.192 ms |
agentgateway handled over 11× more requests per second while maintaining sub-2 ms P99 latency.
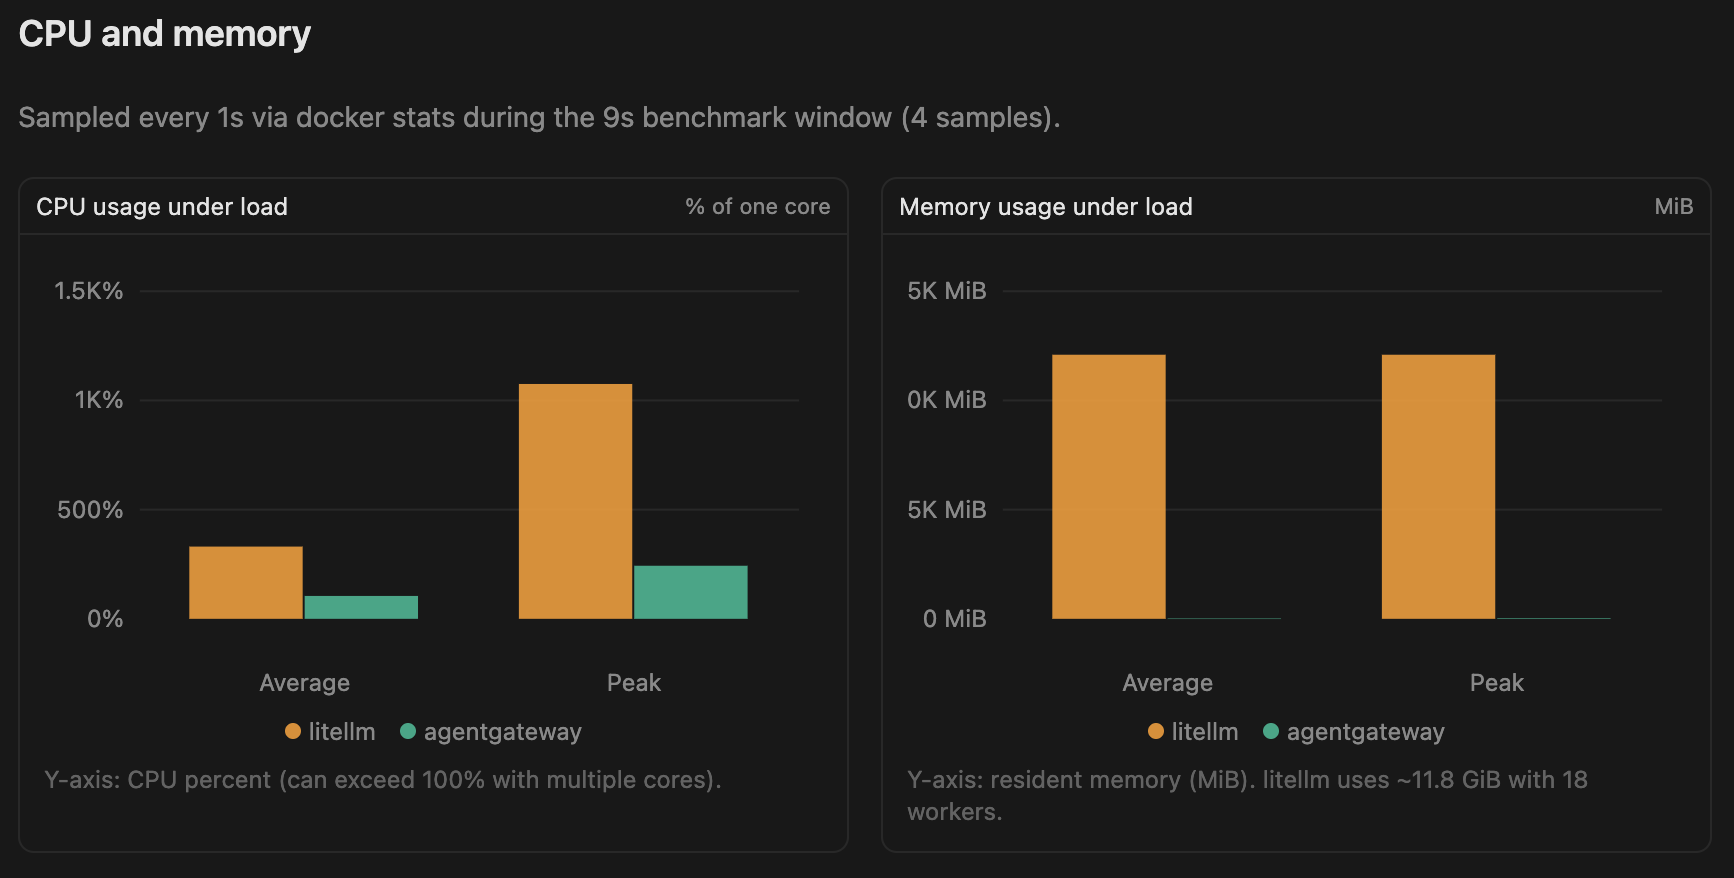
CPU & Memory
| Gateway | Avg CPU | Peak CPU | Avg Memory | Peak Memory |
|---|---|---|---|---|
| agentgateway | 105% | 243% | 22 MB | 29 MB |
| LiteLLM | 331% | 1075% | 11.8 GB | 11.8 GB |
The memory difference was the biggest surprise. During this benchmark, LiteLLM consumed nearly 12 GB of RAM, while agentgateway stayed below 30 MB.
Raw benchmark output
./scripts/run-benchmark.sh
==> Run ID: 20260626-120716
==> LiteLLM workers: 18
...
Running fortio to litellm at 0 QPS for 3s and 32 connections...
qps: 3198.48qps    p50: 7.076ms    p90: 17.986ms    p99: 32.192ms
...
Running fortio to agentgateway at 0 QPS for 3s and 32 connections...
qps: 36933.62qps    p50: 0.831ms    p90: 1.533ms    p99: 1.970ms
...
DEST,CLIENT,QPS,CONS,DUR,PAYLOAD,SUCCESS,THROUGHPUT,P50,P90,P99
litellm,fortio,0,32,3,1104,10186,3198.48qps,7.076ms,17.986ms,32.192ms
agentgateway,fortio,0,32,3,1104,110831,36933.62qps,0.831ms,1.533ms,1.970ms
...
CONTAINER,SAMPLES,AVG_CPU%,PEAK_CPU%,AVG_MEM,PEAK_MEM
perf-agentgateway,4,104.80%,243.02%,22.38MiB,28.79MiB
perf-litellm,4,330.79%,1075.38%,11.81GiB,11.81GiB
perf-mock-server,4,24.52%,81.05%,3.43MiB,3.84MiB
Visualized results
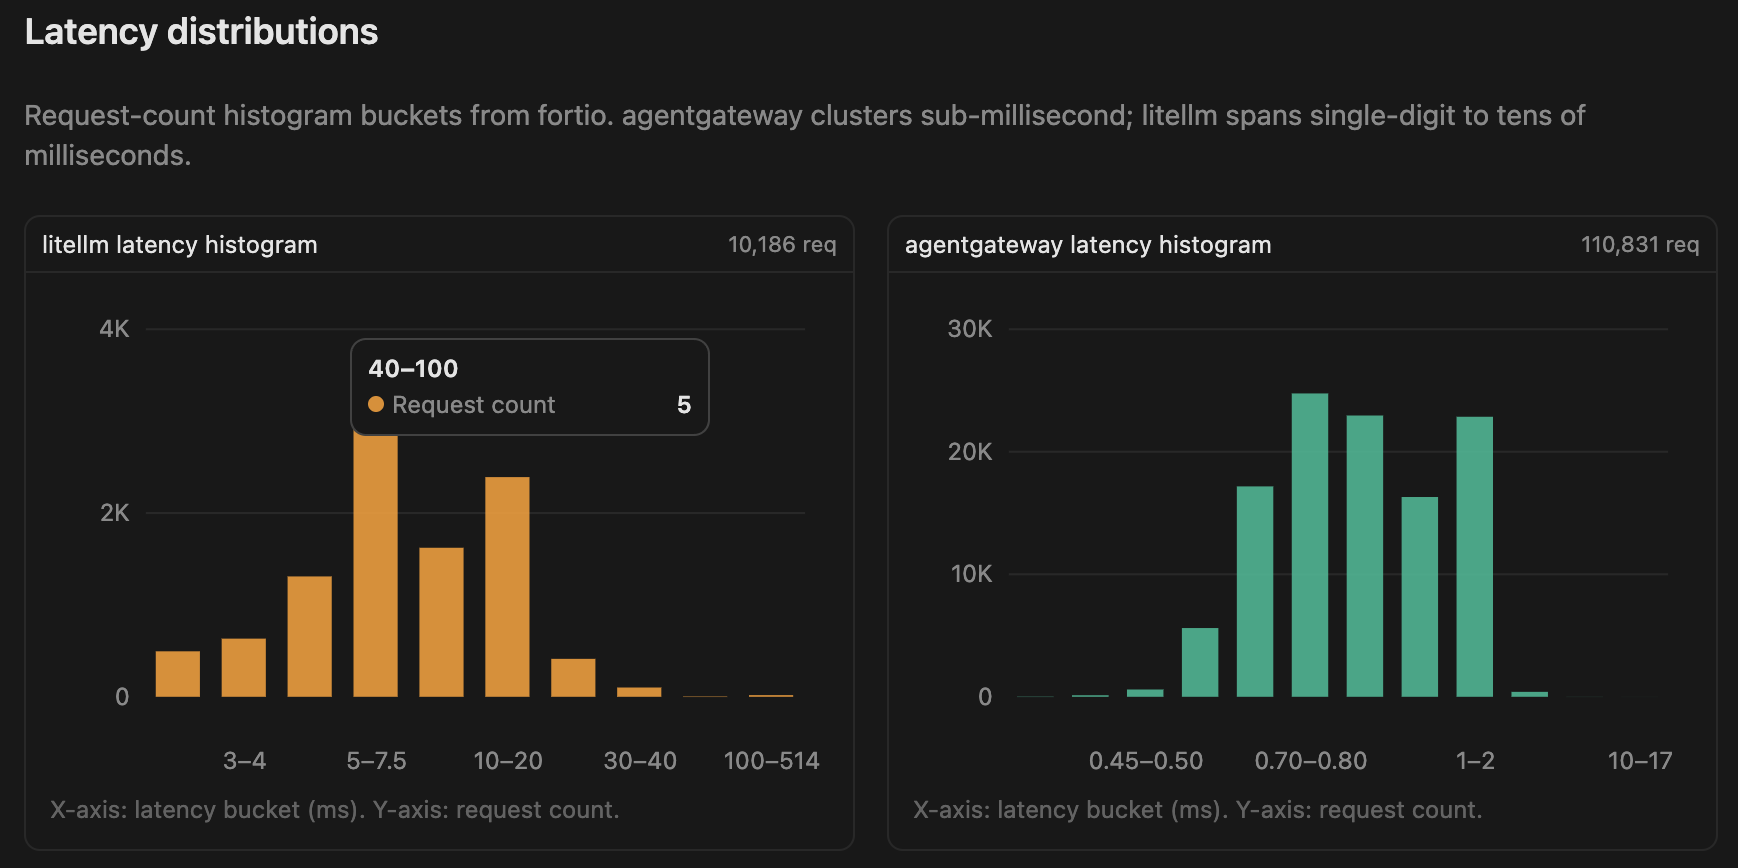
I asked Cursor to turn the raw benchmark data into a few charts:
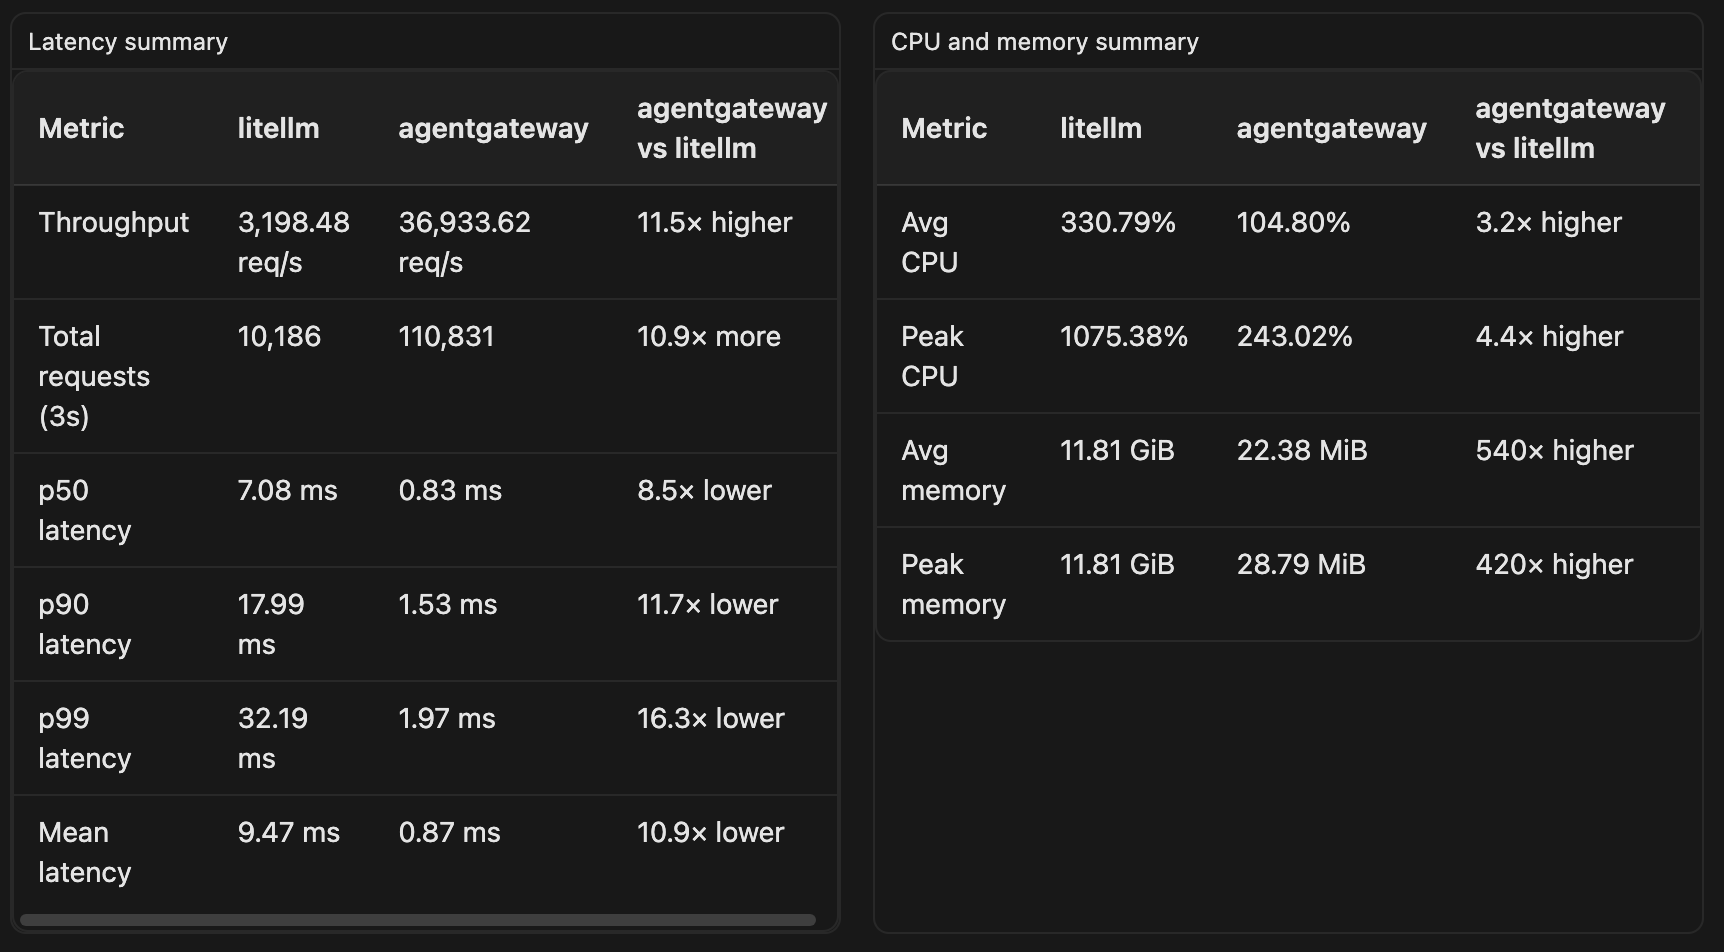
Takeaways
For this benchmark, agentgateway introduced significantly less proxy overhead than LiteLLM:
- ~11.5× higher throughput
- Much lower (~10×) latency across all percentiles
- ~500× lower memory usage
- Lower CPU utilization
This benchmark intentionally isolates proxy performance by using a mock backend, so it doesn’t measure real LLM inference latency or feature completeness. If your workload is dominated by model inference, the differences will be less noticeable. However, if you’re building high-throughput AI services or running a local gateway that handles many concurrent requests, proxy overhead becomes much more important.
Based on these results, I’m going to switch my local setup to agentgateway and use it to manage all of my LLM traffic.
Because each gateway handled a different workload in this test, I followed up with Part 2 using a fixed 3,000 QPS target for both gateways to make the comparison more apples-to-apples.
The complete benchmark scripts and raw results are available in the GitHub repository if you’d like to reproduce the numbers yourself.